Cardiac Optical Imaging
Introduction
Every year, in the United States alone, millions of people die suddenly of lethal arrhythmias, called sudden cardiac death (SCD). In order to understand how these diseases can generate lethal arrhythmia, a number of revolutionary techniques have been developed, including the three-dimensional high resolution cardiac optical imaging for cardio-electrodynamics. However, it is very time consuming to manually analyze the 3D data and identify the patterns associated with various arrhythmia symptoms. This is why no standard techniques for the acquisition and the interpretation of the data have been established.
The goal of this project is to develop an open framework with an array of software tools to help researchers automatically elucidate the arrhythmia mechanisms. The success of this project will shed light on the development of new direction of arrhythmia research and therapeutic strategy to treat the patients who are suffering from these terrible diseases.
The impact of the proposed project is twofold: (1) significantly improve understanding of correspondence between automated extracted features for computerized automated identification (such as Activation, Restitution, Action Potential Duration, local velocity, frequency, texture, and other statistical parameters) and the heterogeneity of the APD map as well as the propogation of activation map used by physicians to identify different arrhythmia disease model; and (2) advances integration of feature extraction, model selection, and classification in bio-medical imaging processing.
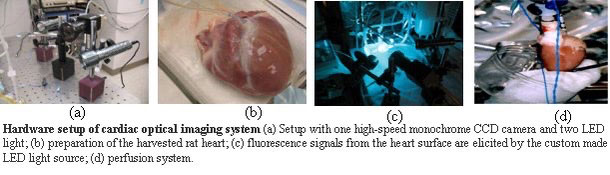
Data Acquisition
The 3D cardiac optical imaging is based on proportional change of the induced fluorescence intensity resulting from the change in the trans-membrane potentials in dye-stained tissue. This powerful tool can record the membrane potential signals (i.e., Action Potential (AP) in the excitable tissues) from millions of sites simultaneously.
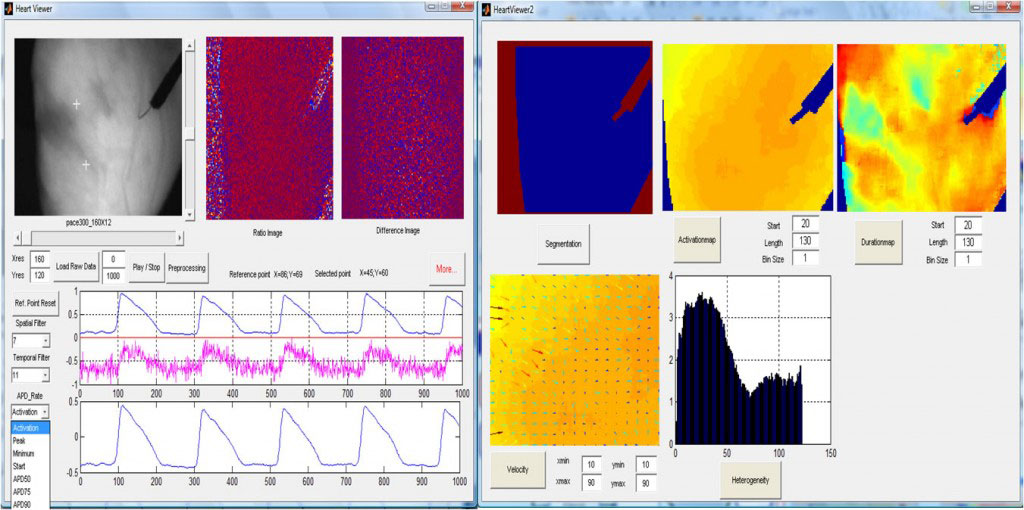
Cardiac Optical Imaging Wizard (COI-Wiz)
A automatic analysis tool is created to help the researchers analyze the 3D cardiac optical imaging data and one example run is shown in the following figure.
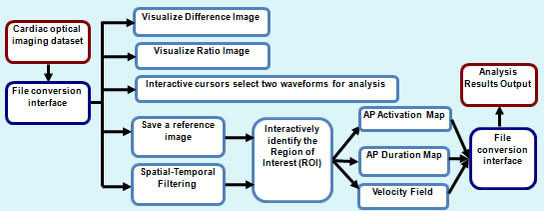
System Architecture
System architecture shows the algorithms involved in the COI-Wiz.
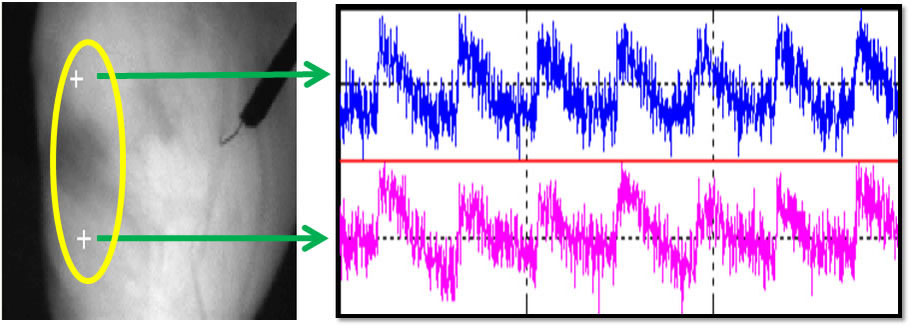
Waveform Visualization and Analysis
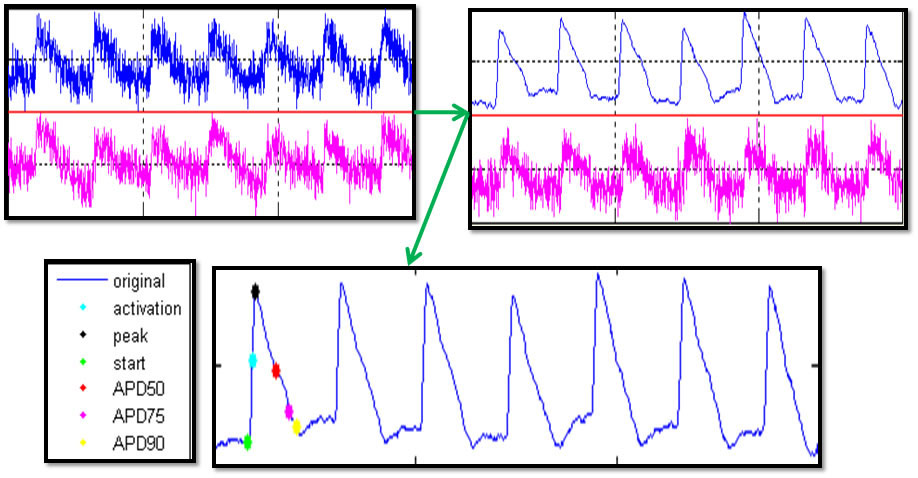
User can select a reference point and another point to study the difference of action potential signals between two positions., The two action potential waveforms are visualized without any filtering on the right blue waveform. The pink waveform shows the AP signal of the reference position, which can be reset.
Action Potential Activation and Duration
The raw AP signal is very noisy and is not suitable for further study of extracting useful features for automated analysis. Spatial and temporal filters are applied to improve the signal to noise ratio of the AP signal.The result shows significant improvement of the signal to noise ratio.
Activation and Duration Map
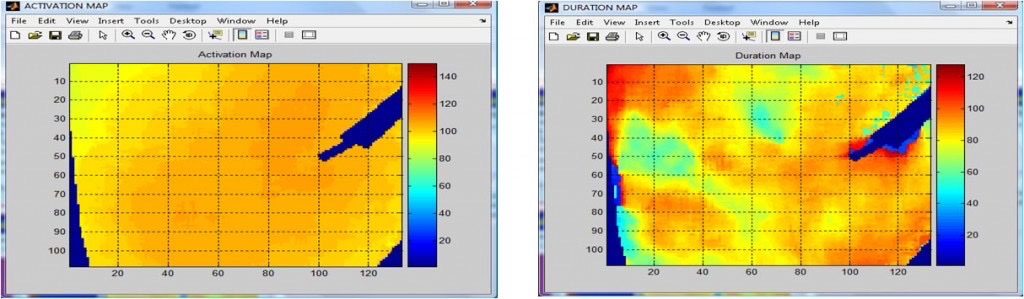
In order to extract activation and duration map, we follow three steps: (1) Identify the starting point and peak amplitude for the AP signal; (2) Calculate APD50, APD75, and APD90; and (3) Generate Activation and Duration Maps. Example maps are shown below.
Conduction Velocity Field Map
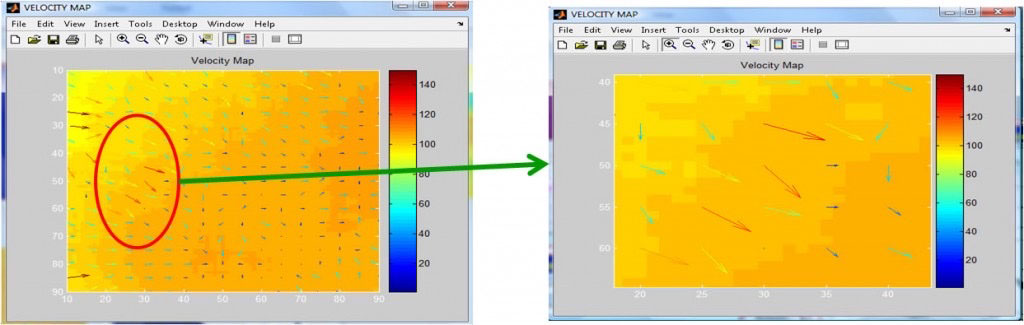
The magnitude and direction of conduction velocity are especially important during complex arrhythmias, but also difficult to measure. We calculate the conduction velocity and represent the velocity vector by arrowed line going from the less intensity to the more intensity pixel. The color bar to the right of the each figure is the reference for the arrowed line.
Conclusion
The computer based cardiac optical imaging analysis tool set, COI-Wiz, provides the automatic analysis as well as interactive selection for cardiac electrophysiology researchers. The whole framework is open and flexible to have other functions incorporated later and can handle different cardiac imaging datasets by adding new file conversion module in the file conversion interface. The spatial and temporal noise of the 3D datasets are reduced using either default filter configurations or user specified configurations. Tools that extract the most popular analysis matrices such as the activation time map, restitution time map, action potential duration map, and the velocity field map are developed and validated in the advanced cardiac electrophysiology research lab located in the Texas Heart Institute. A recent abstract about ¡°vasoactive intestinal polypeptide increased action potential spatiotemporal heterogeneity and vulnerability to atrial fibrillation¡± was accepted by the Heart Rhythm Meeting based on results provided by COI-Wiz. In the future, we plan to extend the COI-Wiz to dual-camera system; add functions to extract and define texture and the heterogeneity of multiple imaging files; and image registration to handle motion artifacts.
COI-Wiz Toolset Download
In order to run the .exe file without installing Matlab, you will need the MCR components. You will get error about mclmccrt*.dll does not exist” if the MCR component was not installed.
*COI_Wiz (MATLAB 7.0.1 version) and *MCR_Component (MATLAB 7.0.1 version)
*COI_Wiz (MATLAB 7.0.4 version) and *MCR_Component (MATLAB 7.0.4 version)
Personnel
Graduate Students working on the project: Ilyas Uyanik and Ning Situ
Collaborators: Drs. Jie Cheng, and Yutao Xi (MD and PhD from THI).