Team 2
Case Study of Remote Management System
Ali Givmanesh, Eric Peters
Introduction
Biochemical engineering researchers have utilized bioreactors as the primary fermentation devices to grow and analyze various cells and tissues in the context of cell culture experiments. The University of Houston biotechnology program currently uses the New Brunswick Scientific BioFlo 110 in two of its laboratory courses to grow transformed bacterial cells; BTEC 4301: Principles of Bio-processing Laboratory and BTEC 4350: Capstone Experience in Biotechnology. The thesis under study explores the technology controlling the BioFlo 110 and proposes a technique to enhance the functionality of the bioreactors as an educational tool by introducing an onsite data logging method and remote monitoring capability. The research conducted throughout this project demonstrates a method of storing and remotely monitoring experimental information via the bioreactor website. This application is employed within the biotechnology courses to provide an additional layer of flexibility to the system while reducing overall time spent in the laboratory. The overall system is shown in Figure 1.
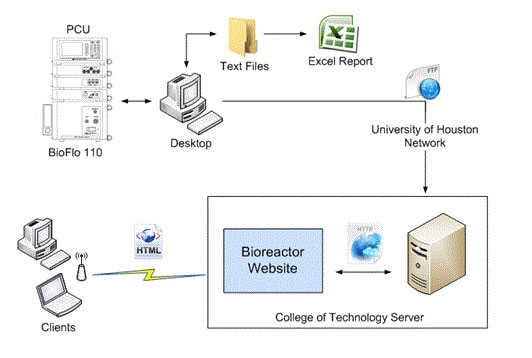
Figure 1: Overall System Architecture
The goal of this case study is to conduct a performance evaluation of an integrated remote management system for Bioprocessing experiments. We hope to identify any potential bottlenecks that exist within the system and characterize expected performance. This system a real-world implementation of an on-going thesis project that provides students and teacher with remote access to dynamic web content derived from a production biotechnology laboratory.
Test Setup
Most performance issues are unique and application dependent. The metrics, benchmarks, and evaluation technique for a particular problem generally cannot be used for another issue. Nevertheless, there are several general steps needed in order to perform a systematic evaluation on a system. The following project plans were defined prior to assessment of the bioreactor website.
1. System Definition: The goal of this case study is to determine if any performance bottlenecks existed within the system relative to the number of users actively logged on to the website. Shown in Figure 2, the system under test consists of an interactive website that fetches and presents user-specified experimental parameters from a bioreactor. The component under study is the web server hosting the web service and the database that delivers the dynamic content. Specifically, the performance of the content management software that runs on the web server is examined.
2. Services provided by the dynamic content generator are:
- Logon user
- Fetch data
- Output data to web page
- Update dynamic web page
- Logoff user
3. Parameters that may affect the performance of the given application are the following:
- Number of users
- Number of modules on page
- Type of web server
- Memory Capacity
4. Metrics being measured in the case study are:
- Average time to fetch data:time taken to query and return data.
- Average page execution time:time taken to output data to requested page
5. Evaluation Technique:
- Measurement: Experimental trials accessing the webpage for different duration and number of users logged on are performed continuously. This allows each metric to be measured under varying loads.
- Simulation: Simulation will be used in the workload in order to determine any potential bottlenecks that exist within the system.
- Analytical Modeling: It is employed to verify the accuracy of the experimental results. This will support the validity of measurements.
6. Workload:
Measurements were taken based on three expected workloads: one user, ten users, and twenty users. These values were based on the standard number of students present in a single biotechnology lab, including the expected minimum, average, and maximum users that might access the website at the same time. The expected results of the performance test were that query time and page execution time would increase as the number of users increased.
The experiment consisted of three independent trials of five samples for each of the three workloads. The Devel module was installed and activated on the Drupal site and allowed the web page to capture the data of interest, including the database query time, page execution time, memory usage, and any related errors. The logging system printed this data for every client request made on the webpage. Multiple clients logged in via various web browsers, refreshing the same node repeatedly in order to simulate page access. This would simulate overlap in page requests of the same data set among multiple users logged on to the website. The results of the measurements are discussed in the following section.
Test Results
The experimental results varied with regard to each metric. Average values of all samples for each respective trial are plotted against the number of users to observe possible trends. Figure 3 indicates there is a direct relationship between the number of users and the database query time. This result is consistent with the initial expected theory prior to the measurements.
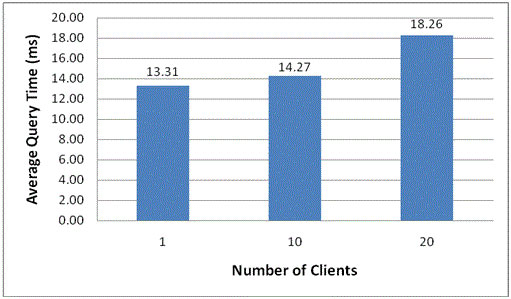
Figure 3: Average Query Time in ms
The analytical modeling of the sample data is used to indicate the accuracy of the measured result with 95% confidence level. The measured data is calculated into a sample mean (M), standard deviation (sM), and standard error (aM) for each time period. A confidence interval was then computed and the results are shown in Table 1.

Table1: Average Query Time at 95% Confidence Level
The page expectation duration however did not reveal similar insights. Despite the increasing number of users, page execution consistently stayed close to the same value throughout the trials. The average value of page execution time is shown in Figure 4 and the results indicate that each dynamic page is executed similarly up to certain number of clients.
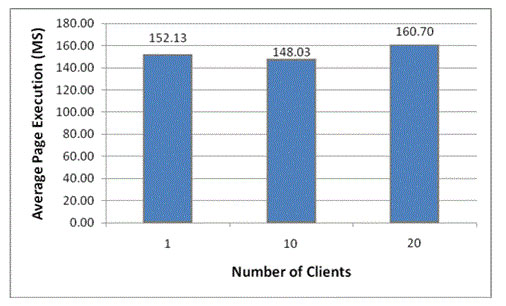
Figure 4: Average Page Execution Time in ms
The coefficient of variation (CoV) of each scenario is calculated and presented in the Table 2. This value presents the measure of dispersion levels among the measurements by normalizing the standard deviation and the mean values. The three coefficients are less than 1, therefore the three tests are low variance. Additionally because the CoV is increasing as the number of users is increasing, it is concluded that higher number of users produces more dispersion in the page execution time. However, it is clear that there is no performance bottleneck related to the page execution time in this evaluation.
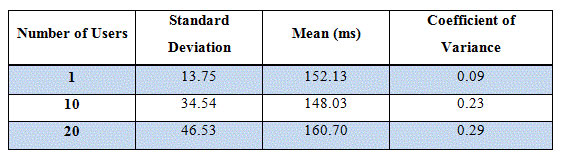
Table 2: Average Page Execution Time at 95% Confidence Level
Conclusion
The remote management system significantly enhances the biotechnology courses. The data logging feature facilitates duplicating experimental trials, and the monitoring website increases productivity. The performance analysis focuses on observing any possible bottlenecks on the website with regard to number of users. The average query time and page execution time was measured as the number of users was increased. Query time did increase directly with the number of users, but based on the results there were no discernable bottlenecks within the system. Overall, the remote management component meets performance expectations, and enriches the biotechnology courses it supports.